Data Visualization
Data Visualization & Analytics using Business Intelligence Tools
Turn Revenue Data Into Actionable Insights
Your practice generates a wealth of financial data—are you using it to its full potential? Our advanced data visualization tools give physicians real-time access to the key metrics that matter most for revenue performance and operational efficiency.
Key Features of Our RCM Analytics Dashboard:
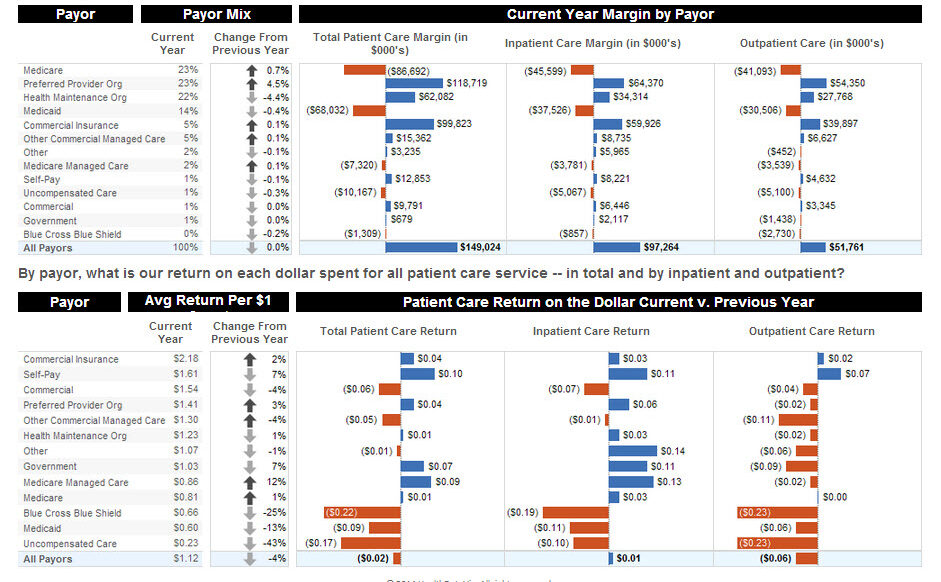
📊 Real-Time Revenue Dashboard
Track charges, collections, adjustments, and write-offs across time and providers.
📈 Claims Performance Insights
Monitor first-pass acceptance rates, denial trends, and payer-specific delays.
📅 AR Aging & Collection Trends
Get a clear view of outstanding receivables by payer and age group—so you can act fast.
📂 Patient Balance Reports
Identify high-risk patient accounts and improve collection strategies with patient-specific data.
🔎 Custom Reports
Generate on-demand reports by provider, location, payer, or specialty for quick decision-making.